I recently built this dashboard for a discretionary market profile trader who was spending 30-45 minutes every morning piecing together the same information from four different sources: a premarket note, TradingView charts, an economic calendar website, and the options chain on their broker platform. The same ritual every day, and half of it was mechanical work that a script could do faster and more consistently.
The result is a single-page dashboard that generates automatically at 9:25 AM ET from live broker data. It pulls market profile, volume profile, gamma exposure, expected move, cash index context, and the economic calendar into one screen with four tabs. The trader opens one URL, scans for 15 seconds, and knows where price sits in context, what the options market implies about today’s range, and whether any events could move the tape. No chart setup, no tab switching, no manual calculations.
The dashboard is organized into four tabs. Here’s what each looks like with real data from May 12, 2026.
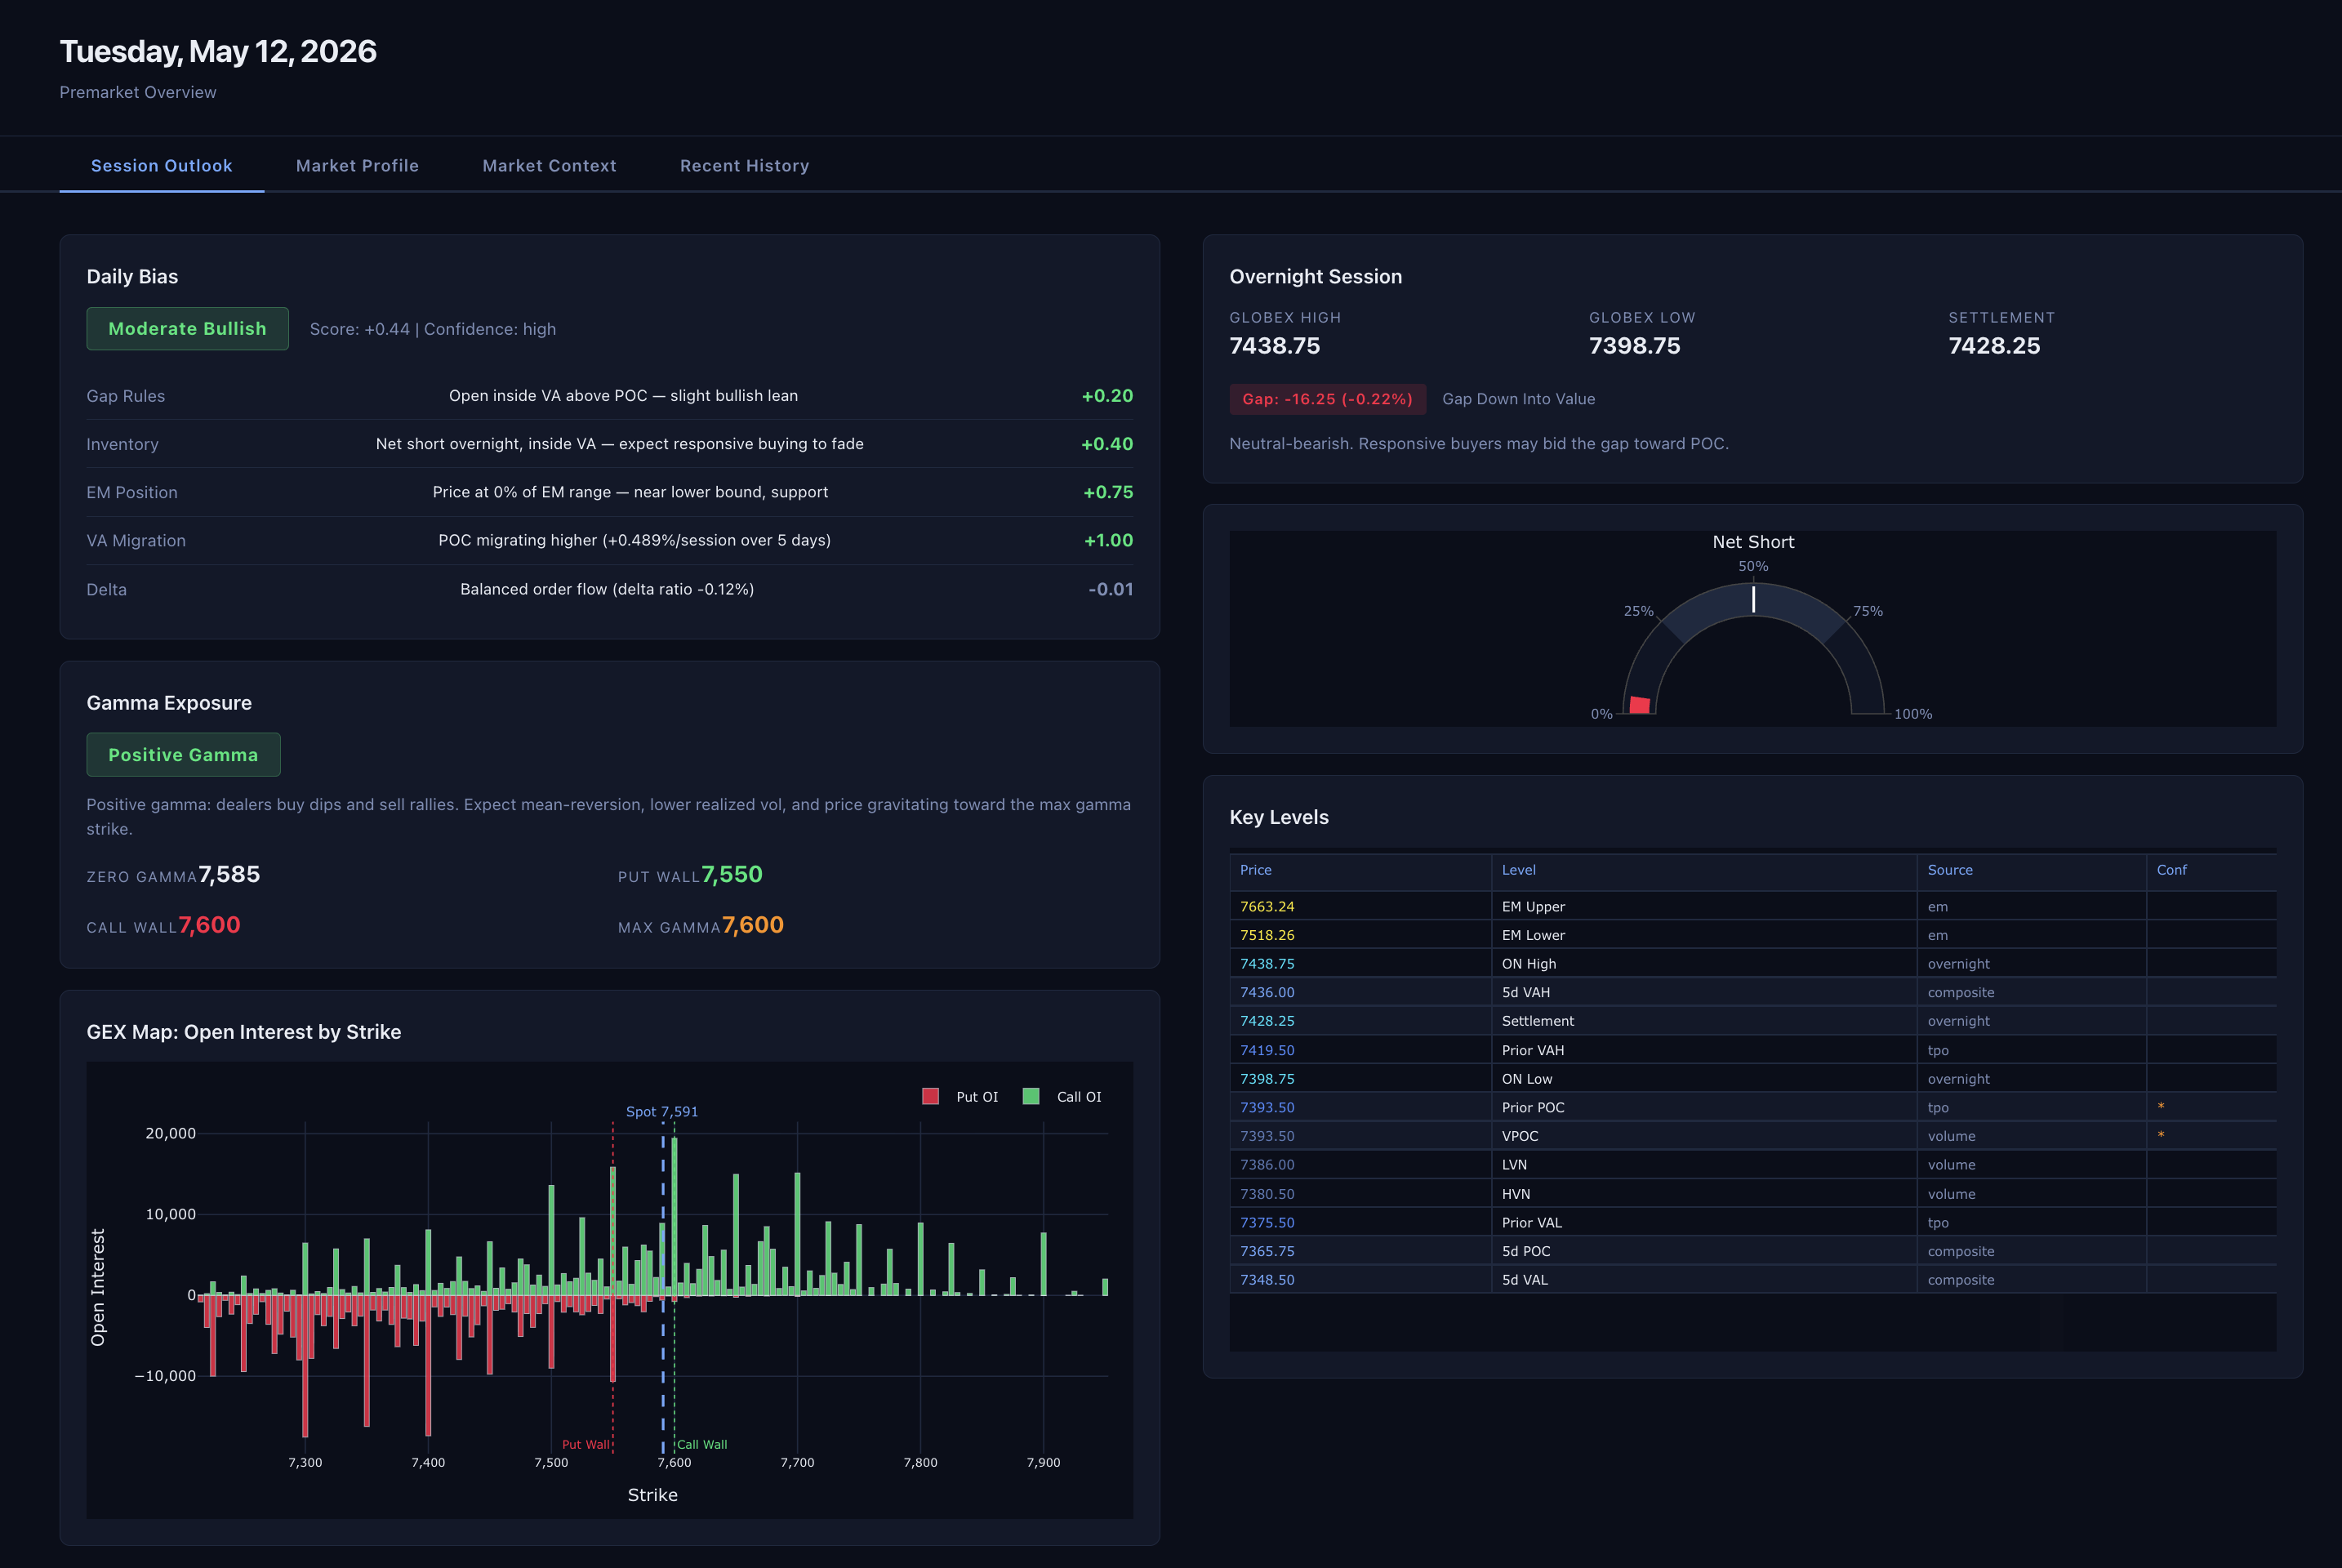
Session Outlook
The default view: daily bias scorecard, gamma exposure regime and GEX map, overnight session context, inventory positioning, and a synthesized key levels table.
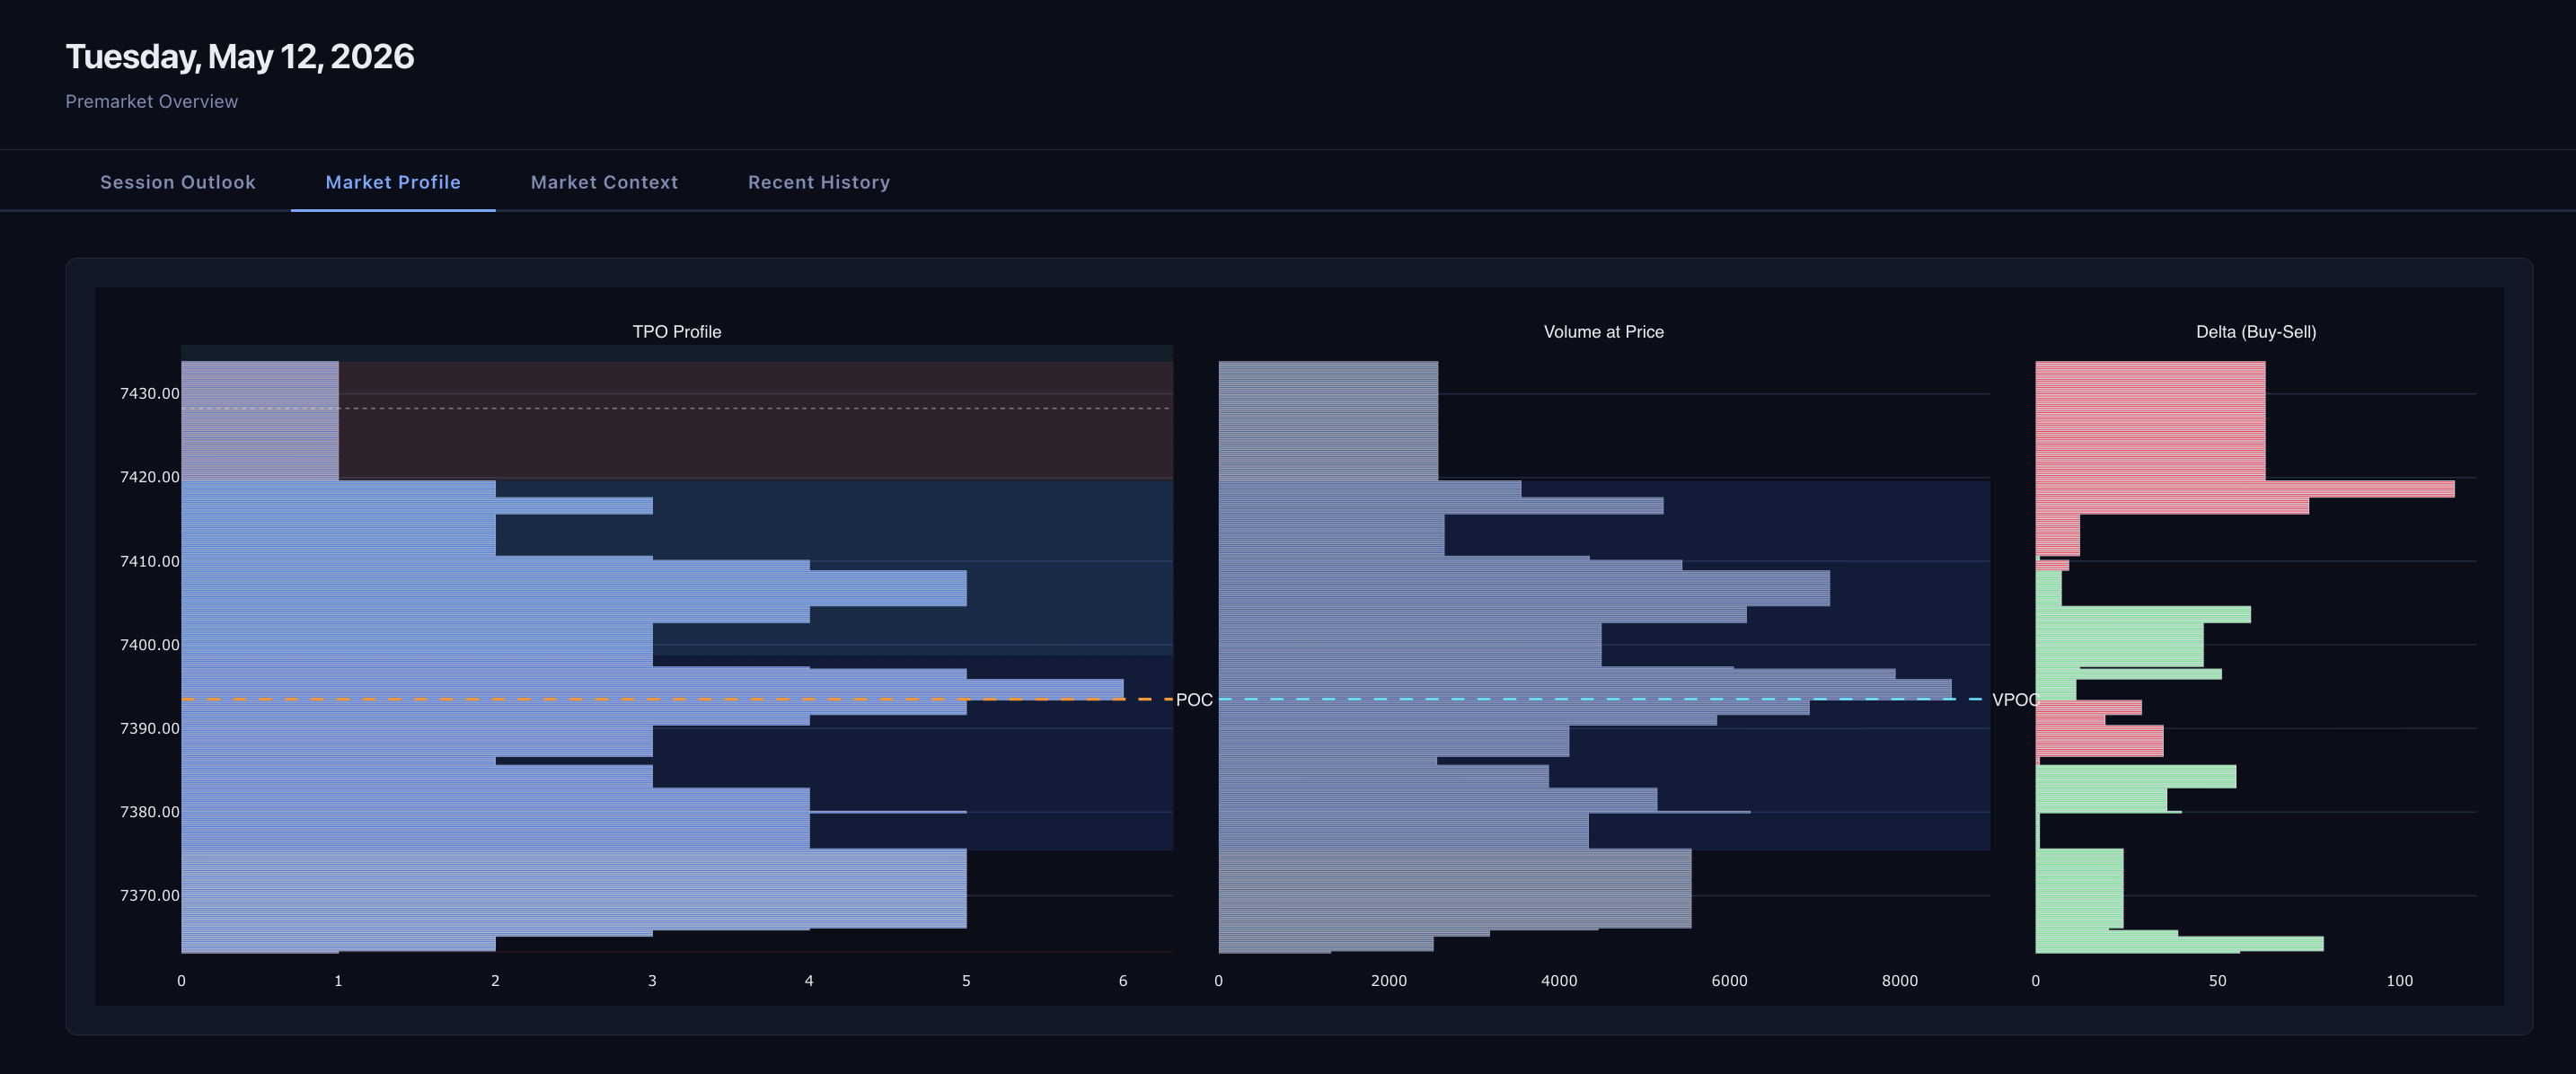
Market Profile
TPO profile, volume at price, and buy/sell delta side by side for the prior session.
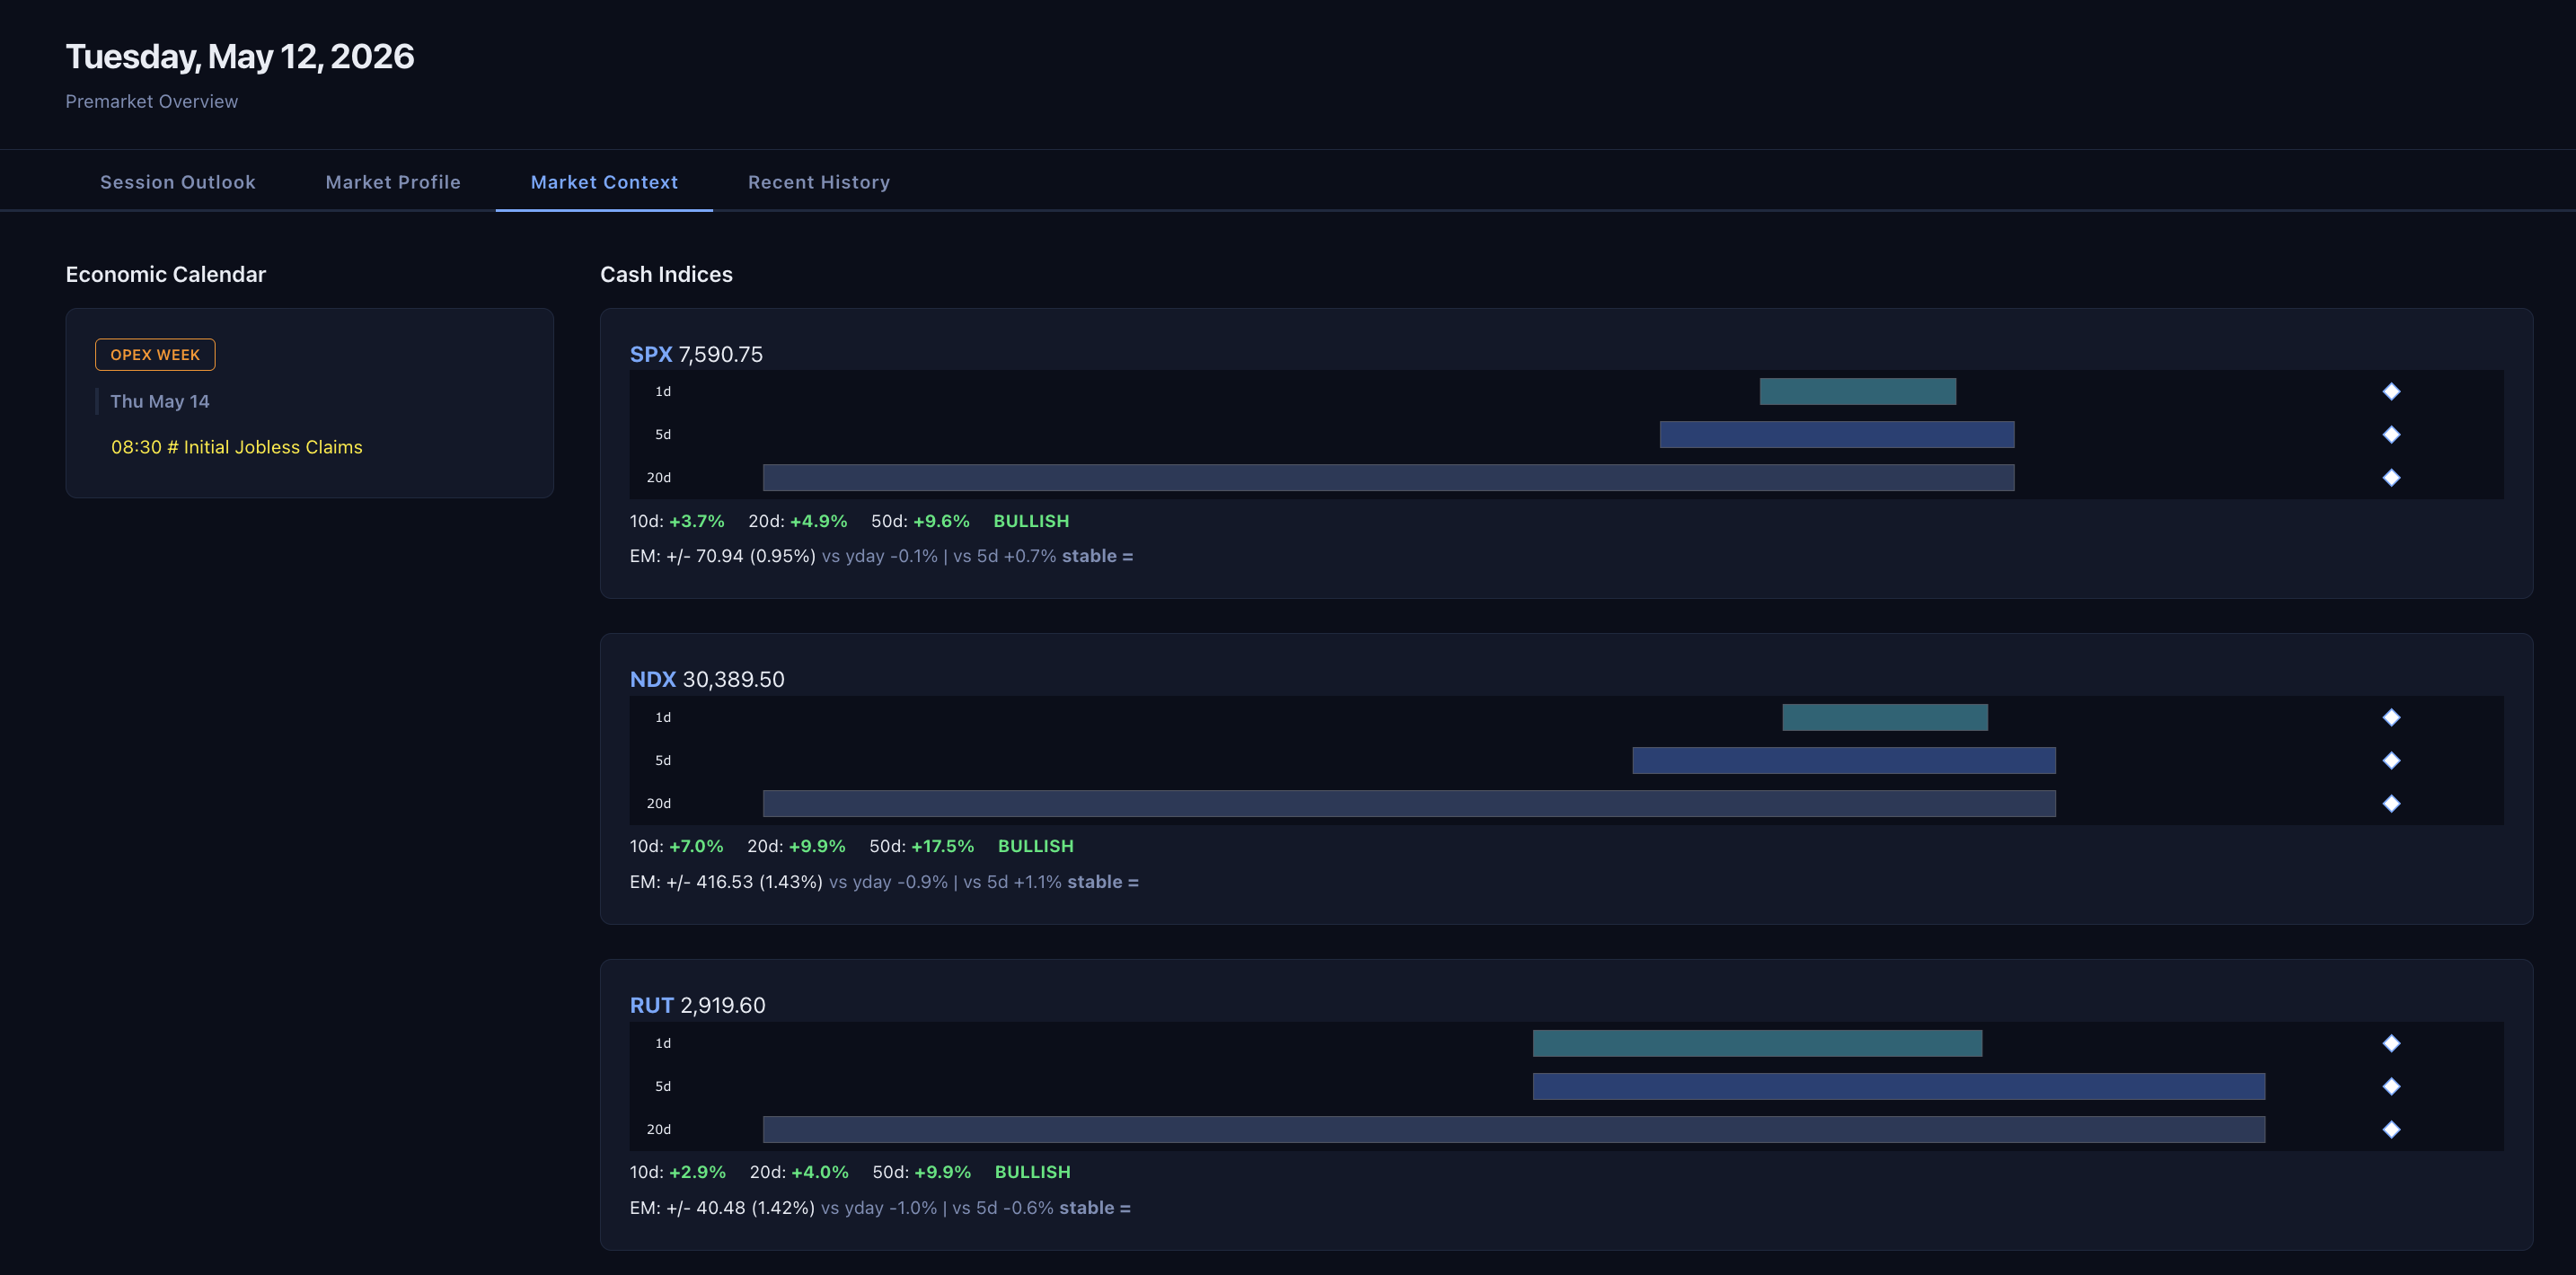
Market Context
Economic calendar (filtered to today, impact-ranked) alongside cash index context for SPX, NDX, and RUT: range positioning, moving average distances, trend alignment, and expected move with trend context.
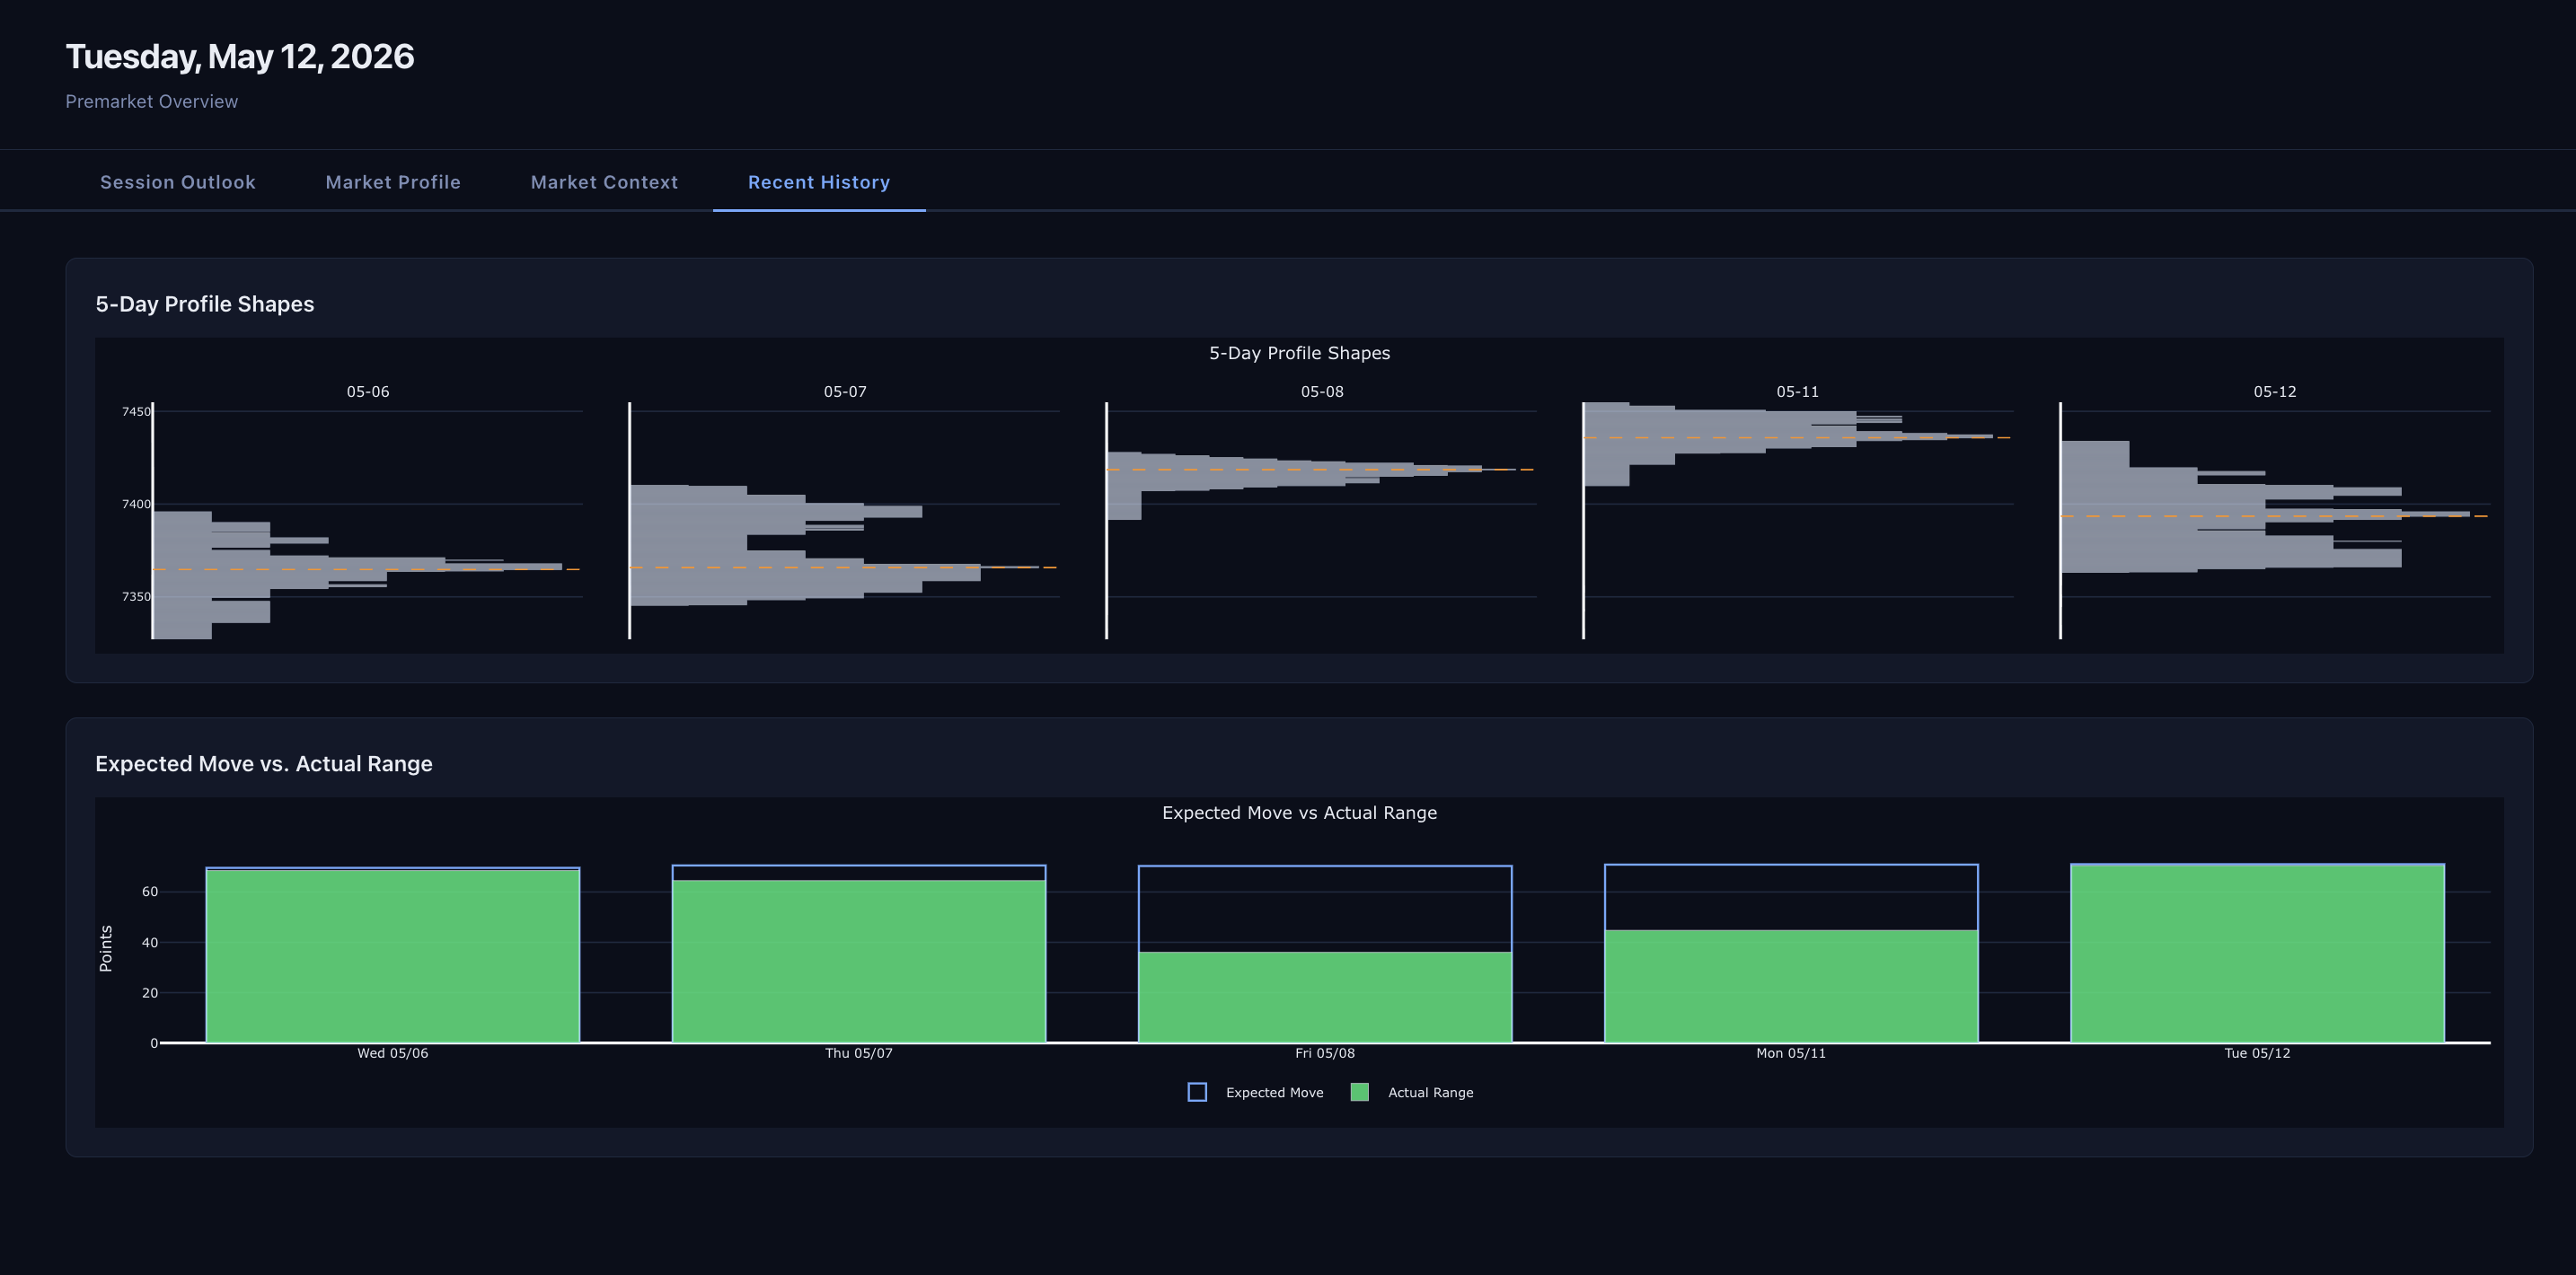
Recent History
Five-day profile shape comparison and expected move vs. actual range tracking to gauge whether the market is using or exceeding its implied range.
What follows is the design specification behind the dashboard: the data models, computation methods, panel layouts, and pipeline architecture. I’m sharing it because the thinking behind each panel is more useful than the code itself. If you trade market profile, you’ll recognize the concepts. If you build trading tools, you’ll see how the pieces fit together.
Design Specification
I. Dashboard Layout (Single Screen, 1400x1050)
+===================================================================+
|  PREMARKET OVERVIEW  Mon 2026-05-12  06:45 ET          [ES][NQ][R] |
+===================================================================+
|                        |                                           |
|   A. CASH INDEX        |   C. MAIN INSTRUMENT                     |
|      CONTEXT PANEL     |      TPO + VOLUME PROFILE                |
|      (SPX/NDX/RUT)     |      + OVERNIGHT OVERLAY                 |
|                        |      + DELTA PROFILE                     |
|   ~280px wide          |                                          |
|   ~500px tall          |      ~780px wide, ~500px tall            |
|                        |                                          |
|   - where in range     |                                          |
|   - distance from MAs  |                                          |
|   - expected move box  |                                          |
|   - put/call ratio     |                                          |
|                        |                                          |
+------------------------+------------------------------------------+
|                        |                                           |
|   B. ECONOMIC          |   D. KEY LEVELS         E. 5-DAY         |
|      CALENDAR          |      + INVENTORY           SPARKLINES    |
|      (today's events)  |        GAUGE               + EXPECTED    |
|                        |                              MOVE CONE   |
|   ~280px wide          |   ~480px wide            ~300px wide     |
|   ~280px tall          |   ~280px tall            ~280px tall     |
|                        |                                          |
+------------------------+------------------------------------------+
II. Panel A: Cash Index Context
Purpose
Give the trader an instant read on where each cash index sits relative to its own structure — not just the price, but the context around it. A swing trader needs to know: are we near the top of a range? How far from the mean? Is the market stretched or compressed?
Cash Index Data Sources
From TastyTrade DXLink Streamer:
Summaryevent forSPX,NDX,RUT:day_open_price,day_high_price,day_low_price,day_close_priceprev_day_close_price,prev_day_volume
Underlyingevent forSPX,NDX,RUT:volatility(30-day IV, VIX methodology)front_volatility,back_volatilityput_call_ratiocall_volume,put_volume,option_volume
- Historical
Candleevents (daily,"1d"interval) for 20-day lookback
From TradeStation REST API (backup/bulk history):
GET /v3/marketdata/barcharts/$SPX.Xwithunit=Daily,barsback=60- Same for
$NDX.Xand$RUT.X
Computations
1. Range Context (visual: bullet chart)
For each index, show where today’s price sits within multiple ranges:
@dataclass
class RangeContext:
    price: Decimal
    prior_day_high: Decimal
    prior_day_low: Decimal
    week_high: Decimal       # 5-day high
    week_low: Decimal        # 5-day low
    month_high: Decimal      # 20-day high
    month_low: Decimal       # 20-day low
    range_percentile: float  # 0.0 = at 20d low, 1.0 = at 20d high
Visualization: nested bullet chart
SPX 5,892.40  [+0.34%]
20d  |████████████████████●████|  78th %ile
 5d  |██████████████████████●██|  88th %ile
 1d  |█████████████●███████████|  55th %ile
Three thin horizontal bars stacked, each showing the price’s position within that time range. Instant visual read: “near the top of the weekly range but mid-range intraday.”
2. Distance from Key Moving Averages
@dataclass
class MAContext:
    sma_10: Decimal
    sma_20: Decimal
    sma_50: Decimal
    dist_from_10: float   # percentage distance
    dist_from_20: float
    dist_from_50: float
    trend_alignment: str  # "bullish" (10>20>50), "bearish", "mixed"
Visualization: compact sparkline + distance labels A 60-day price sparkline (~120px wide) with the three MAs overlaid as colored lines. Below it, three compact distance readings:
10d: +0.4% 20d: +1.2% 50d: +3.8% [BULL]
Color-coded: green if price above MA, red if below.
3. Expected Move (see Section III for full computation)
A compact box showing:
┌─ EXPECTED MOVE (1d) ─────┐
│  SPX: +/- 42.3 (0.72%)   │
│  vs yesterday: 38.1       │
│  vs 5d avg:    45.6       │
│  ▼ contracting            │
└───────────────────────────┘
4. Put/Call Ratio Context
From the Underlying event:
P/C Ratio: 0.82  [5d avg: 0.91, 20d avg: 0.88]
Options Vol: 2.1M calls / 1.7M puts
A simple gauge:
BEARISH ←━━━━━━━━━━●━━━→ BULLISH
                0.82
   1.2                        0.6
Combined Panel A Rendering
All four components stack vertically within ~280px width:
┌─ SPX 5,892.40 (+0.34%) ──────┐
│                                │
│ [bullet chart: range context]  │
│ [sparkline + MA distances]     │
│ [expected move box]            │
│ [P/C ratio gauge]              │
│                                │
├─ NDX 21,440 (+0.52%) ────────┤
│ [same four components]         │
├─ RUT 2,105 (-0.12%) ─────────┤
│ [same four components]         │
└────────────────────────────────┘
Each index gets ~160px of vertical space. The panel is dense but scannable — a trader can read the full cross-index context in 5 seconds.
III. Expected Move Computation
What It Is
The market’s implied 1-day price range, derived from at-the-money option prices. If the ATM straddle for tomorrow’s expiry costs $42, the market implies SPX will move roughly +/- $42 from the current price. This is the options market’s consensus forecast of magnitude (not direction).
Method 1: ATM Straddle Price (Most Direct)
The nearest-expiry ATM straddle mid price gives the market’s implied 1-day move directly. If the straddle costs $42, the market implies +/- $42. For multi-day expirations, scale by 1/sqrt(DTE) to get the 1-day equivalent.
@dataclass
class ExpectedMove:
    magnitude: Decimal      # absolute dollar move (1 sigma)
    pct: float              # as percentage of underlying price
    upper: Decimal          # underlying + magnitude
    lower: Decimal          # underlying - magnitude
    source: str             # "atm_straddle" or "implied_volatility"
    dte: int = 1
Method 2: From Implied Volatility
Convert annualized IV to 1-day expected move: EM_1d = Price * IV * sqrt(1/252). This gives 1 standard deviation, roughly a 68% probability the actual move is smaller.
Comparison: Today vs. Yesterday vs. 5-Day Average
@dataclass
class ExpectedMoveContext:
    today: ExpectedMove
    yesterday: ExpectedMove
    avg_5d: ExpectedMove
    trend: str             # "expanding", "contracting", "stable"
    today_vs_yesterday: float
    today_vs_5d_avg: float
The trend classification is simple: if today’s EM exceeds the 5-day average by more than 10%, volatility is expanding. Below 90%, contracting. Otherwise stable.
Visualization: Expected Move Cone (Panel E)
On the 5-day sparkline panel, overlay a translucent cone projecting from the current price:
Price
  ^
  |          ╱  today's EM
  |        ╱────────────
  |      ╱   ╱  5d avg EM
  |    ╱───╱─────────────
  |  ●
  |    ╲───╲─────────────
  |      ╲   ╲
  |        ╲────────────
  |          ╲
  +──────────────────────> Time
  Prior 5 days    Today
Two cones: the outer (lighter) is today’s EM, the inner (darker) is the 5-day average EM. If today’s cone is wider, volatility is expanding. The trader sees this at a glance without reading numbers.
IV. Panel B: Economic Calendar
Calendar Data Sources
Option 1: TradingEconomics API (preferred)
- Free tier: 1000 requests/month
- Endpoint:
GET /calendar?c=united-states&importance=3 - Fields:
Date,Event,Actual,Previous,Forecast,TEForecast,Importance - Importance: 1=low, 2=medium, 3=high
Option 2: Scrape CME FedWatch + FOMC calendar
- For rate decision probabilities specifically
Option 3: financialmodelingprep.com
GET /api/v3/economic_calendar?from=2026-05-12&to=2026-05-12- Fields:
event,date,country,actual,previous,estimate,impact
Option 4: Static calendar with known dates
For the most impactful events (FOMC, NFP, CPI, PPI, retail sales, GDP, jobless claims), the dates are published months in advance. A static calendar supplemented by API data is the most reliable approach.
@dataclass
class EconomicEvent:
    time: time          # ET
    name: str
    impact: str         # "high", "medium", "low"
    previous: str | None
    forecast: str | None
    actual: str | None  # filled after release

@dataclass
class EconomicCalendar:
    date: date
    events: list[EconomicEvent]
    fomc_day: bool
    opex_week: bool     # options expiration week
    quarter_end: bool

### Known high-impact recurring events
HIGH_IMPACT_EVENTS = {
    "FOMC Rate Decision",
    "Nonfarm Payrolls",
    "CPI (YoY)", "Core CPI (YoY)",
    "PPI (YoY)", "Core PPI (YoY)",
    "GDP (QoQ)",
    "Initial Jobless Claims",
    "Retail Sales (MoM)",
    "PCE Price Index (YoY)",
    "ISM Manufacturing PMI",
    "ISM Services PMI",
    "Consumer Confidence",
    "Michigan Consumer Sentiment",
    "JOLTS Job Openings",
    "Durable Goods Orders",
}
What Makes an Event “Market Moving” for a Day Trader
Not all economic events matter equally. The dashboard should filter and rank by likely intraday impact:
Tier 1 — high probability of moving ES 10+ points:
- FOMC rate decisions and statements
- Nonfarm payrolls (first Friday of month)
- CPI / Core CPI (typically mid-month)
- Major geopolitical events (can’t predict, but flag if known)
Tier 2 — moderate probability of moving ES 5-10 points:
- PPI, retail sales, GDP revisions
- Initial jobless claims (every Thursday 8:30 ET)
- ISM Manufacturing and Services PMI
Tier 3 — usually low impact but can surprise:
- Consumer confidence, Michigan sentiment
- Housing data, durable goods
- Fed speakers (impact depends on who and timing)
Visualization
A compact timeline with only today’s events, color-coded by impact:
┌─ CALENDAR Mon 2026-05-12 ───────────────────┐
│                                               │
│  08:30  ██ CPI (YoY)      Est: 2.4%  Prev: 2.6%  │
│  08:30  ██ Core CPI (YoY) Est: 2.8%  Prev: 2.8%  │
│  10:00  █  Michigan Sent.  Est: 67.5  Prev: 65.2  │
│  13:00     10Y Auction                             │
│  14:00     Fed Barkin speaks                       │
│                                               │
│  ██ = high impact  █ = medium  (blank) = low │
│                                               │
│  Flags: OPEX WEEK                             │
└───────────────────────────────────────────────┘
Events are sorted by time. Pre-market events (before 9:30) are separated from intraday events. The forecast vs. previous is shown inline so the trader knows what the market expects.
After the release, Actual replaces Est: and is colored green (better
than expected) or red (worse). This is a live update if the dashboard
is served as a web page.
Contextual Flags
Beyond individual events, flag structural calendar conditions:
def compute_calendar_flags(cal_date: date) -> list[str]:
    flags = []
    # OPEX week (third Friday of month)
    if is_opex_week(cal_date):
        flags.append("OPEX WEEK")
    # Quad witching (third Friday of Mar/Jun/Sep/Dec)
    if is_quad_witching(cal_date):
        flags.append("QUAD WITCHING")
    # Month-end rebalance window (last 3 trading days)
    if is_month_end_window(cal_date):
        flags.append("MONTH-END REBAL")
    # FOMC blackout period
    if is_fomc_blackout(cal_date):
        flags.append("FOMC BLACKOUT")
    # First/last day of quarter
    if is_quarter_boundary(cal_date):
        flags.append("QUARTER BOUNDARY")
    # VIX expiration (typically Wed before 3rd Fri)
    if is_vix_expiration(cal_date):
        flags.append("VIX EXP")
    return flags
These structural events affect market behavior in predictable ways:
- OPEX week: increased gamma exposure, potential pinning effects
- Month-end: pension and index fund rebalancing flows
- FOMC: reduced liquidity in lead-up, volatility spike on release
- Quad witching: massive volume, unusual price action at close
V. Panel C: Main TPO + Volume Profile (Expanded)
This is the same centerpiece panel from the prior design, but with two additions:
Addition 1: Delta Profile (from TastyTrade bid_volume/ask_volume)
A third column alongside the TPO and volume profiles:
Price   TPO Profile     Volume Profile    Delta Profile
5895    BBB             ████              ██▓ (+)
5894    BBCC            ██████            ████▓ (+)
5893    ABCCD           █████████  ←VPOC  ░░░░░ (neutral)
5892    AABCCCDD        ████████████      ░░░░░░░ (-)
5891    AABCD    ←POC   ██████████        ░░░░░░░░░ (-)
5890    AABCD           ████████          ░░░░░░ (-)
5889    AAB             ████              ░░░░ (-)
Delta = bid_volume - ask_volume at each price level.
- Positive delta (green): more aggressive buying (lifting offers)
- Negative delta (red): more aggressive selling (hitting bids)
- This shows WHERE buyers and sellers were active, not just how much volume traded. A high-volume node with negative delta is distribution (selling into strength). One with positive delta is accumulation.
def compute_delta_profile(candles_by_price: dict[Decimal, list[Candle]]):
    """Compute cumulative delta at each price level."""
    delta_at_price = {}
    for price, candles in candles_by_price.items():
        bid_vol = sum(c.bid_volume or 0 for c in candles)
        ask_vol = sum(c.ask_volume or 0 for c in candles)
        delta_at_price[price] = bid_vol - ask_vol
    return delta_at_price
Addition 2: Expected Move Bounds on the Price Axis
Draw two horizontal dashed lines on the TPO panel at:
current_price + expected_move(upper EM bound)current_price - expected_move(lower EM bound)
This shows the trader where the options market expects price to stay today, overlaid directly on the structural levels from the profile. If the upper EM bound aligns with a volume node or value area edge, that level becomes doubly significant.
VI. Panel D: Key Levels Table + Inventory Gauge (Expanded)
Level Synthesis
Merge levels from all sources and rank by significance:
@dataclass
class Level:
    price: Decimal
    label: str
    source: str          # "tpo", "volume", "overnight", "cash", "em", "ma"
    significance: int    # 1-5, 5 = most significant
    confluence: int      # how many sources agree within N ticks

def synthesize_levels(
    tpo_profile: MarketProfile,
    vol_profile: VolumeProfile,
    overnight: OvernightAnalysis,
    composite: CompositeProfile,
    cash_context: dict[str, RangeContext],
    expected_move: ExpectedMove,
    ma_context: MAContext,
) -> list[Level]:
    """Merge all levels, detect confluence, rank by significance."""
    raw_levels = []

    # TPO levels
    raw_levels.append(Level(tpo_profile.poc, "Prior POC", "tpo", 4, 0))
    raw_levels.append(Level(tpo_profile.vah, "Prior VAH", "tpo", 3, 0))
    raw_levels.append(Level(tpo_profile.val, "Prior VAL", "tpo", 3, 0))

    # Volume profile levels
    raw_levels.append(Level(vol_profile.vpoc, "VPOC", "volume", 4, 0))
    for hvn in vol_profile.hvns:
        raw_levels.append(Level(hvn, "HVN", "volume", 2, 0))
    for lvn in vol_profile.lvns:
        raw_levels.append(Level(lvn, "LVN", "volume", 2, 0))

    # Overnight
    raw_levels.append(Level(overnight.globex_high, "ON High", "overnight", 3, 0))
    raw_levels.append(Level(overnight.globex_low, "ON Low", "overnight", 3, 0))
    raw_levels.append(Level(overnight.settlement, "Settlement", "overnight", 4, 0))

    # Composite
    raw_levels.append(Level(composite.poc, f"{composite.n_days}d POC", "tpo", 5, 0))
    raw_levels.append(Level(composite.vah, f"{composite.n_days}d VAH", "tpo", 4, 0))
    raw_levels.append(Level(composite.val, f"{composite.n_days}d VAL", "tpo", 4, 0))

    # Expected move bounds
    raw_levels.append(Level(expected_move.upper, "EM Upper", "em", 2, 0))
    raw_levels.append(Level(expected_move.lower, "EM Lower", "em", 2, 0))

    # Moving averages (mapped to futures via basis adjustment)
    # ...

    # Detect confluence: levels within 2 points of each other
    for i, level in enumerate(raw_levels):
        for j, other in enumerate(raw_levels):
            if i != j and abs(level.price - other.price) <= 2:
                raw_levels[i] = replace(level, confluence=level.confluence + 1)

    # Boost significance for confluent levels
    for level in raw_levels:
        if level.confluence >= 2:
            level.significance = min(5, level.significance + 1)

    return sorted(raw_levels, key=lambda l: l.price, reverse=True)
Visualization: Levels Table with Confluence Markers
 Price    Level          Source     Conf  │ ← ON Range →
 ─────────────────────────────────────────│──────────────
 5,895    EM Upper       Options     ·    │         ·
 5,892    ON High        Overnight  ··    │        ●
 5,889    5d VAH         Composite  ···   │      ●
 5,885    Prior VAH      TPO         ·    │    ●
 5,881    VPOC / Prior   Vol+TPO   ····   │  ●        ← CONFLUENT
 5,878    Settlement     Session     ·    │ ●
 5,871    Prior VAL      TPO         ·    │●
 5,865    5d VAL         Composite  ··    │●
 5,860    ON Low         Overnight   ·    │●
 5,855    EM Lower       Options     ·    │·
The dot-plot column on the right shows spatial relationships. Confluence dots (····) tell the trader which levels have multiple structural reasons to matter.
VII. Panel E: 5-Day Sparklines + Expected Move Cone
5-Day Profile Sparklines
Five tiny TPO profile silhouettes (no labels, just shapes) showing the profile evolution:
  Mon    Tue    Wed    Thu    Fri
  ╻      ╻╻     ╻     ╻╻╻    ╻╻
  ╻╻     ╻╻╻    ╻╻    ╻╻╻╻   ╻╻╻
  ╻╻╻    ╻╻╻╻   ╻╻╻   ╻╻╻╻╻  ╻╻╻╻  ← widening = balance
  ╻╻╻╻   ╻╻╻    ╻╻╻╻  ╻╻╻╻   ╻╻╻╻╻
  ╻╻╻    ╻╻     ╻╻╻   ╻╻╻    ╻╻╻╻
  ╻╻     ╻      ╻╻    ╻╻     ╻╻╻
  ╻               ╻    ╻      ╻╻
Overlaid annotations:
- A horizontal line connecting each day’s POC shows value migration
- Value area high/low connected across days shows balance/expansion
- Today’s expected move cone extends from Friday’s close
Expected Move Comparison Strip
Below the sparklines, a compact strip comparing today’s EM to recent:
EM History (1-sigma, points)
Mon   ████████████████████░░░░  42.3
Tue   █████████████████░░░░░░░  38.1
Wed   ██████████████████████░░  46.2
Thu   ████████████████████████  48.9   ← vol spike (CPI day)
Fri   ███████████████████░░░░░  40.5
─────────────────────────────────────
Today █████████████████████░░░  44.1   5d avg: 43.2
Filled bars = actual range that day. Unfilled = EM that wasn’t used. This shows whether the market is using its full expected move or trading inside it. Consistently using >100% of EM suggests the IV model underestimates realized vol. Consistently using <70% suggests the options are overpriced (useful for options sellers).
VIII. Actual Range vs. Expected Move Tracking
This is an analytical edge that most premarket services don’t offer.
@dataclass
class RangeVsEM:
    date: date
    expected_move: Decimal      # 1-sigma EM at open
    actual_range: Decimal       # high - low for the session
    range_em_ratio: float       # actual_range / expected_move
    settled_within_em: bool     # did price close within EM bounds?
The computation is straightforward: range_em_ratio = (high - low) / expected_move for each session.
Why this matters for traders:
- If the market has been using only 60% of its EM for 5 straight days, it’s “coiling” — volatility compression often precedes expansion
- If the market exceeded 100% of EM 3 of the last 5 days, realized vol is running ahead of implied vol — expect options premiums to catch up
- The ratio trend (expanding or contracting) tells you whether the market is becoming more or less predictable
IX. Data Pipeline Architecture
                    ┌──────────────┐
                    │  TastyTrade  │
                    │  DXLink      │
                    │  Streamer    │
                    └──────┬───────┘
                           │ Candle (1m, 30m)
                           │ Quote, Summary
                           │ Underlying (IV, P/C)
                           │ Greeks (for EM calc)
                           ▼
┌──────────────┐    ┌──────────────┐    ┌──────────────┐
│ TradeStation │    │              │    │  Economic     │
│ REST API     │───▶│   QuestDB    │◀───│  Calendar API │
│ (bulk hist)  │    │  (storage)   │    │  (or static)  │
└──────────────┘    └──────┬───────┘    └──────────────┘
                           │
                           ▼
                    ┌──────────────┐
                    │   Polars     │
                    │  (compute    │
                    │   profiles,  │
                    │   EM, etc.)  │
                    └──────┬───────┘
                           │
                    ┌──────┴───────┐
                    ▼              ▼
             ┌───────────┐  ┌───────────┐
             │ matplotlib │  │  Jinja2   │
             │ (SVG/PNG)  │  │ (Hugo .md)│
             └─────┬──────┘  └─────┬─────┘
                   │               │
                   ▼               ▼
             ┌───────────────────────────┐
             │  Hugo site / daily post   │
             │  content/premarket/       │
             │  2026-05-12.md            │
             └───────────────────────────┘
Data Fetch
A single fetch at ~09:25 ET captures everything needed: prior session daily bars (20-day lookback), the finalized overnight range, the economic calendar for the day, and current IV for expected move computation. Compute all profiles and render the dashboard immediately after. The entire pipeline runs once, produces one snapshot, and is done before the 09:30 open.
Futures Symbol Resolution
Futures symbols follow the standard month code convention (H=Mar, M=Jun, U=Sep, Z=Dec for quarterly contracts). The dashboard needs to resolve the front-month contract automatically based on the current date and the quarterly expiration cycle.
The cash-to-futures basis (futures price minus cash index price) is needed to map cash index levels (like SPX moving averages) onto the futures price axis in the TPO panel.
X. What This Dashboard Replaces
The trader I built this for was doing all of this manually every morning:
| What they were doing | How long it took | What the dashboard does instead |
|---|---|---|
| Reading a premarket note (~2800 words) | 5-8 min | 15-second scan of the Session Outlook tab |
| Setting up TradingView charts per instrument | Several minutes of clicking | All 3 instruments, profiles auto-computed |
| Checking an economic calendar website | Separate tab, filtering by country | Pre-filtered to today, impact-ranked |
| Digging through broker options chain for expected move | Navigation through multiple screens | Front and center with trend context |
| Calculating MA distance with a ruler on the chart | Per instrument, per MA | All indices, all MAs, at a glance |
The total went from 30-45 minutes of prep to opening one URL and scanning for 15 seconds. The dashboard doesn’t replace their trading judgment. It replaces the mechanical work of assembling the context they need to apply that judgment.
Interested?
I built this for one trader’s workflow, but the problems it solves are common to anyone who trades market profile on index futures. If you’re a market profile trader spending your mornings assembling the same context from multiple sources, I’d be interested in hearing whether a tool like this would be useful to you. Reach me at me@susanpotter.net .

Susan Potter
Quant
Work with me
I spent the first half of my career building risk models and market data infrastructure at BNP Paribas, Bank of America, and Citadel, then fourteen years shipping production systems at scale. Now I bring both sides to quantitative trading. If you're a trading firm, family office, or fund looking to tighten the connection between your research ideas and your production trading systems, whether that's building validation pipelines, formalizing signal logic, or getting microstructure analytics into a deployable state, I'd like to hear what you're working on. Reach me at me@susanpotter.net.